PMT and FGPA Simulation
2-Photon Microscope Image Acquisition - PMT and FGPA Simulation
The improvement of signal-to-noise ratio is important challenge for 2-photon laser scanning systems because it greatly effect image quality. 2-photon microscopes use a laser to measure the photons emitted by fluorophore cells in brain tissue. The process of converting photons to pixels starts with the photomultiplier tube (PMT). As part of the external circuit connected to the PMT, the lowpass transimpedance amplifier is used to convert a current pulse to a voltage signal. In this circuit, the cut-off frequency is an adjustable parameter that changes the resultant output signal. Amplifiers with high cut-off frequencies (>10Mhz) have sharper responses than amplifiers with low cut-off frequencies (<5Mhz). Synchronization is required for amplifier with high cut-off frequencies because the sampling rate of the digitizer (80Mhz-120Mhz) is typically not fast enough to capture the estimated photon emissions without aliasing the signal. Aliasing is caused, primarily, by probabilistic, Poisson noise associated with arrival of photons after each beam pulse. This simulation quantifies the estimated photon emission signal for synchronized and unsynchronized digitizers.
Other sources of noise were not included in this simulation. These source of noise include the variability of the PMT’s output amplitude and the “bleed through” noise associated with the amplifier.
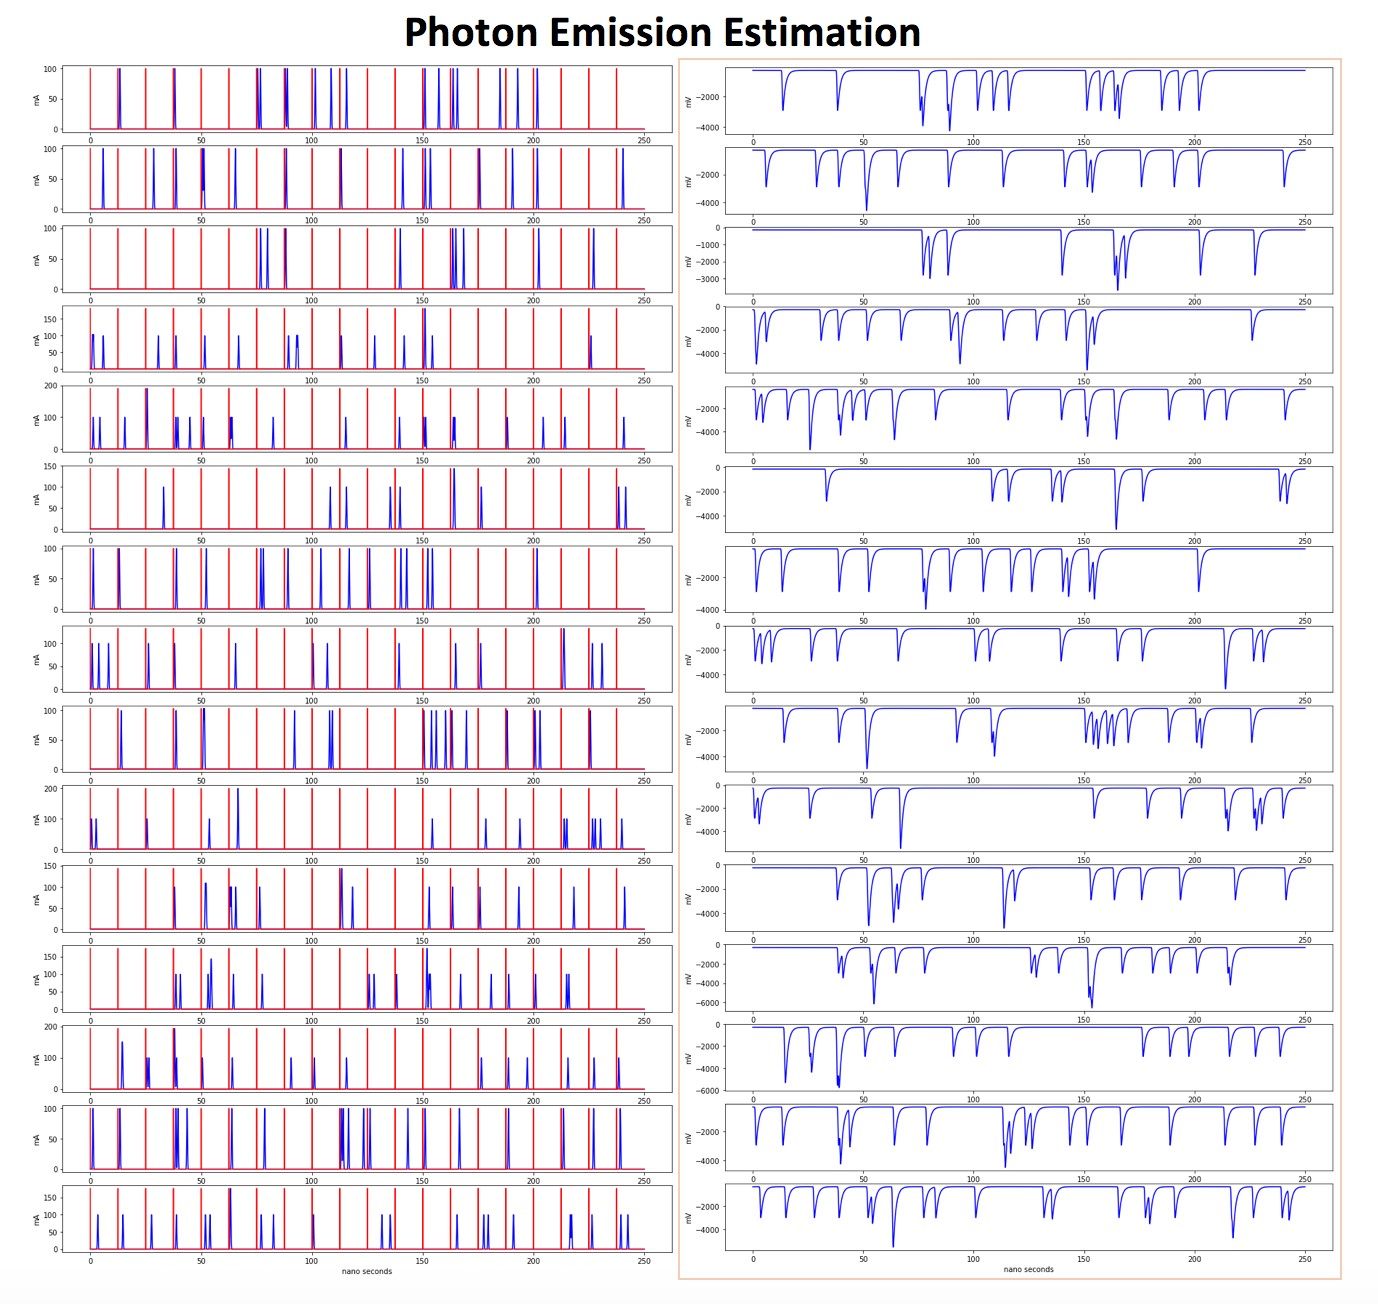
A Monte Carlo simulation was used to simulate the arrivals of photons, from the light source. The photon discrete pulses were transformed into current pulses using a truncated Gaussian kernel. The current pulses are shown in Fig.1 (left). A Poisson process determined the number of current pulses after each beam, and an Exponential process that determined how long after each beam pulse the output current would occur. This Poisson process used a mean number of 1 current pulses and the Exponential process has a mean time of 2.5 ns after each beam pulse . A high cut-off (80Mhz) transimpedance amplifier was simulated in the Fourier domain and then convolved with the PMT current output to generate the amplifier output, shown in Fig.1 (right).
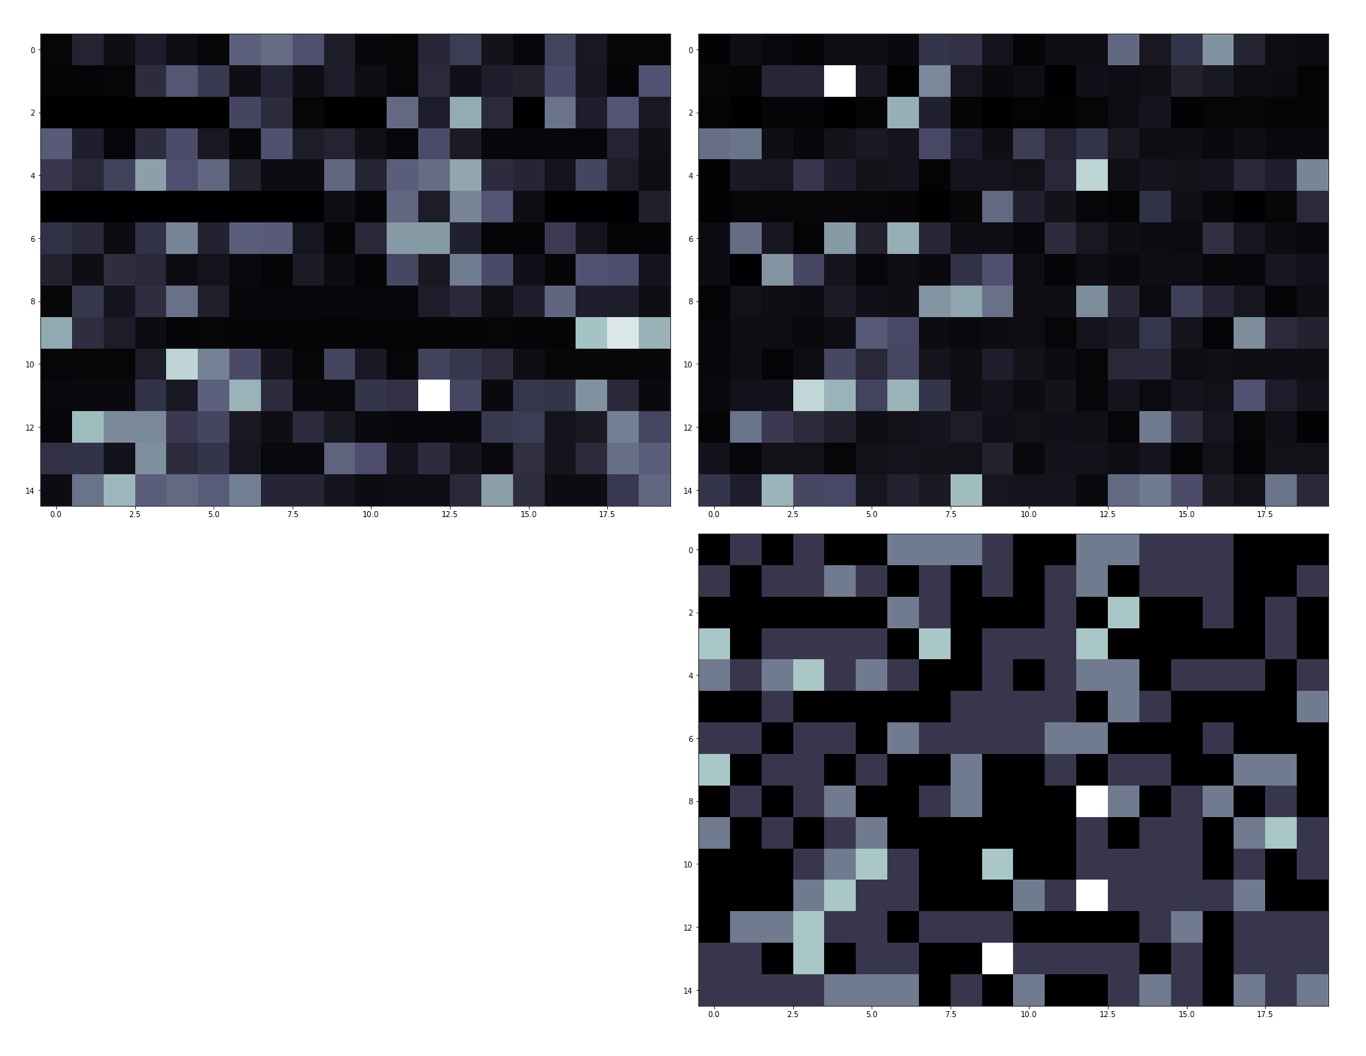
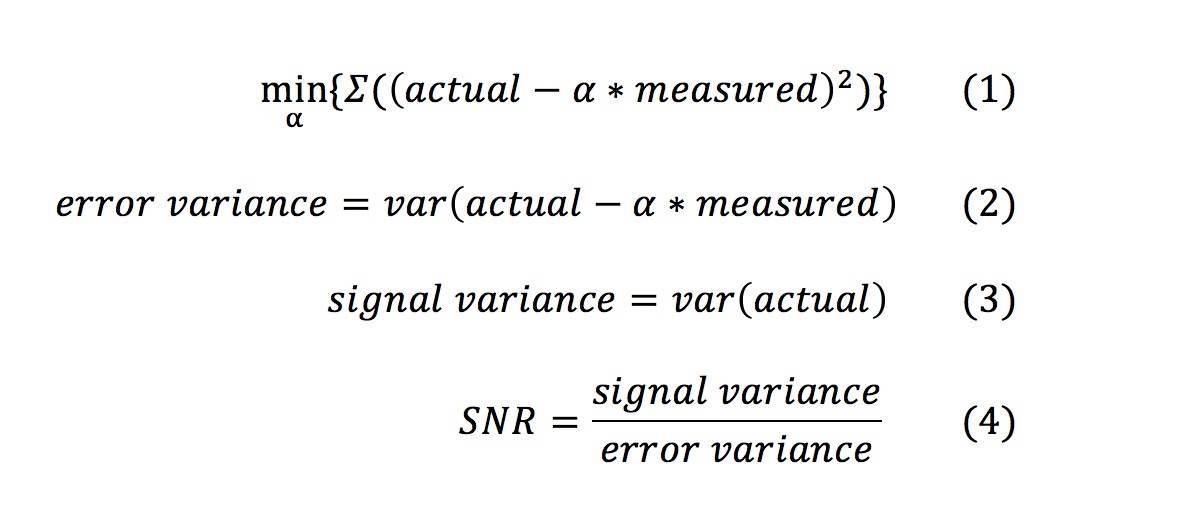
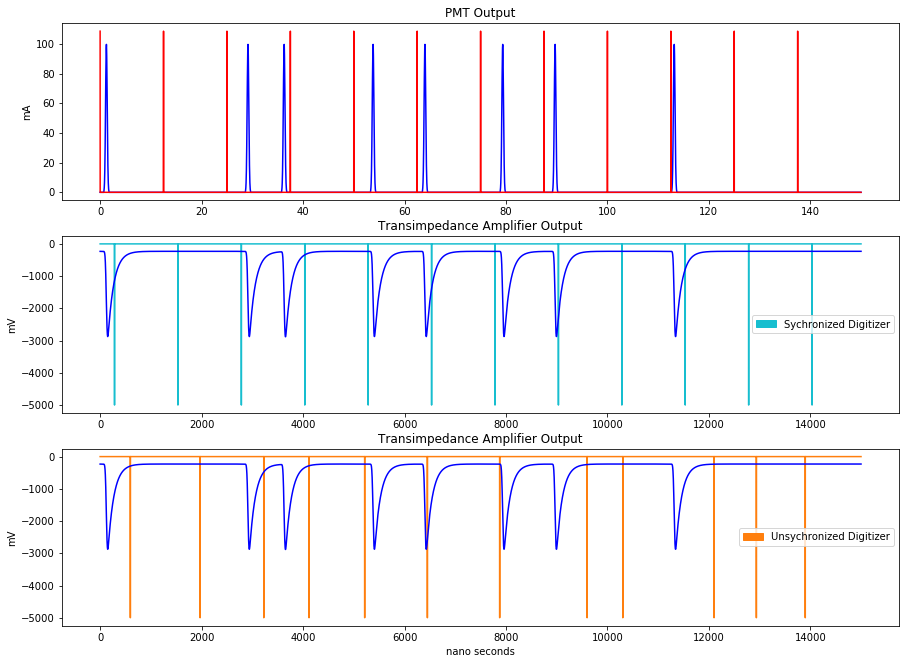
The digitizer samples the current output from the PMT to create an image. The digitizer can be synchronized with the FGPA output that generates the laser. The synchronized digitizer (top left) samples the amplifier output every 2.5 ns + some phase delay after each beam pulse while the unsynchronized digitizer (top right) randomly samples the signal uniformly between 0 ns — 10 ns. The images in Fig.2 were generated by scaling the sampled values between 0 and 255. The signal-to-noise ratio can be calculated for the collected and true images(Eq.4). An optimal scaling factor (Eq.1) that relates the measured signal to the actual needs to be found to compare the two signals. The optimal scaling factor was found by using a no-intercept regression model. Subtracting these two signals, or images, gives the error signal. The signal-to-noise can then be calculated by finding the error’s variance (Eq.2) and the signal variance (Eq.3). In reality, the optimal scaling factor is unknown and the histogram of the raw values are manually scaled or truncated, but since this is a simulation the error is known. The average increase in SNR was estimated with 5,000 simulations each with 15 lines and 20 beam pulses each line. The synchronized and unsynchronized digitizer had an average SNR of 1.55 and 1.12, respectively.
Generating the PMT, Transimpedance Amplifier, and Digitizer Outputs
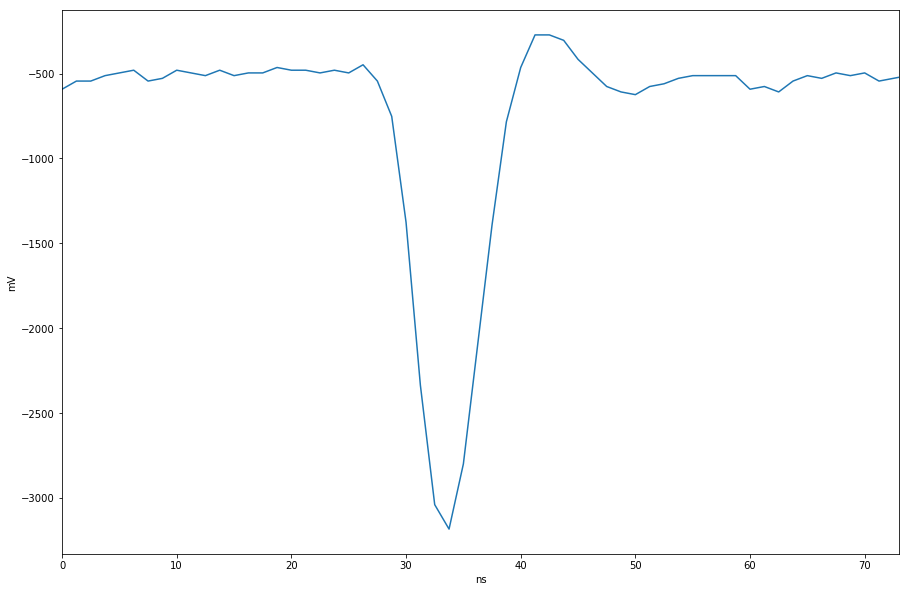
The output from the PMT, amplifier, and digitizer used in this simulation were assumed to operate in ideal conditions. In addition, the components of the amplifier were chosen to match real-world amplifier output, shown in Fig.6.
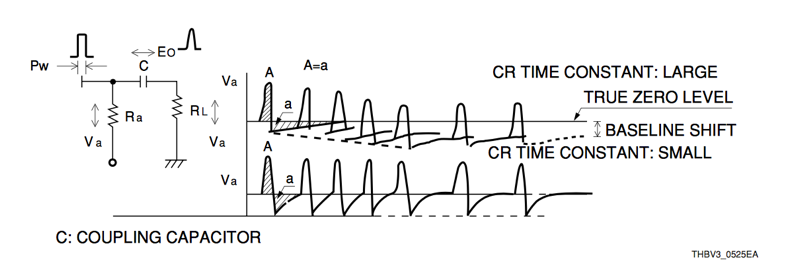
The typical scale for a current pulse from a Hamamatsu PMT is around 100mA and has a duration of 1 ns, shown in Fig.3. The x-axis in Fig.3 is nanoseconds while each time tick is 10000 fs (or 10e-2 ns). Typically, researchers use a Ti:Sapphire laser that produces pulses at a frequency of 80MHz. The simulated beam pulses are shown by red vertical lines and are evenly spaced by 12.5 nanoseconds or 12.5e2 data points. The simulated PMT output will be assumed to have a coupling capacitor to eliminate DC components. In addition, the current output pulse width Pw of the PMT will be assumed to be sufficiently shorter than the time constant CR in the coupling circuit to eliminate distortions to the output waveform. When the amount of charge stored on the capacitor, shown in Fig.4, is discharged in a certain time period the area of portion A is equal to the area of portion a. (More information can be found in the Hamamatsu manual.) Making this assumptions allows for the discharge period and base line shift to be ignored.
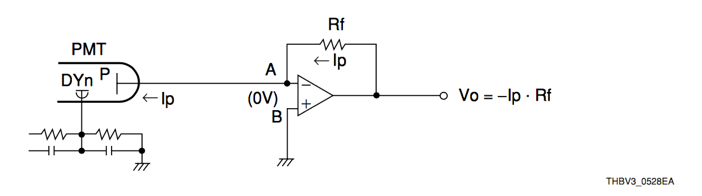
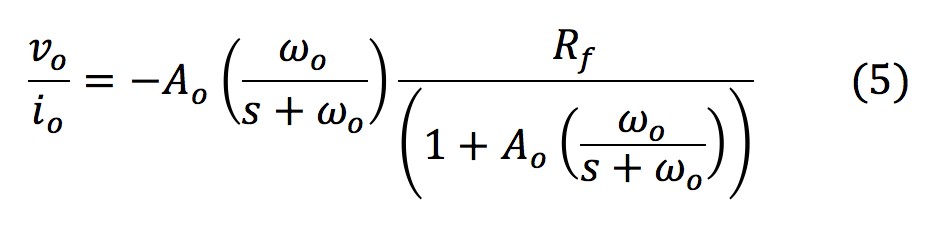
An operational amplifier can be used as the current-to-voltage conversion circuit. An ideal current-to-voltage conversion circuit using an operational amplifier is shown in Fig.5. For the purpose of making a simulation, the operational amplifier will be assumed to operate ideally and with a negligible feedback signal so that no capacitors will be needed. The derived op-amp transfer function is shown in Eq.5. The convolution of this transfer function with the simulated PMT output then generates the simulated amplifier output.
The parameters of the transfer function were chosen to match a real world experiment that utilized a fast field gate programmable array (FPGA) that sampled the amplifier output at 800Mhz. The experiment used a gain of 0.7 and a cut-off frequency of 80Mhz. The output resistance was empirically determined to be 500 ohms to match the output of the FGPA measurement, shown in Fig.6.
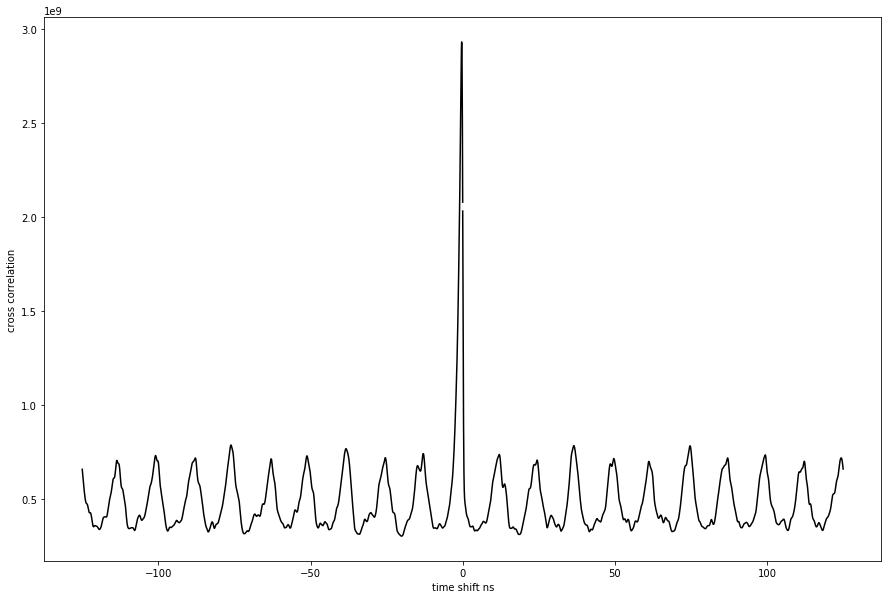
The response of the amplifier is almost deterministic in that it produces roughly the same delay to the peak of its response from the peak of the PMT output. Ideally the digitizer should be synchronized with the phase delay in order to sample the signal at the “sweet spot.” Cross correlation matrices were created between PMT and amplifier outputs for 20 simulations to identify the optimal phase shift. The average shift, shown in Fig.7, was found to be .34 ns from the average peak location of the current output pulse, which is 2.5 ns.
When using a high cut-off frequency, it is important that the digitizer is synchronized and has a fast enough sampling rate to avoid aliasing of the post-amplifier signal and to resolve fine details in the image. This simulation shows that the signal-to-noise ratio can be improved by choosing the appropriate phase delay.
Resources:
Thorlabs PMT: https://www.thorlabs.com/drawings/8df6ba5b30cf8bb7-859D76DE-B571-439E-97F94181ECA44DA7/PMT2101-Manual.pdf
Hamamatsu PMT: https://www.hamamatsu.com/resources/pdf/etd/PMT_handbook_v3aE.pdf
NI Digitizer: http://www.ni.com/pdf/manuals/375653a.pdf
Transimpedance Amplifier Design: http://www-f9.ijs.si/~margan/Articles/trans_z_amplifier.pdf